

More Top Stories


$12.9m approved for solar battery project, NZ confirms
12 March 2025

Crown Law Office on track for record number of lawyers
12 March 2025


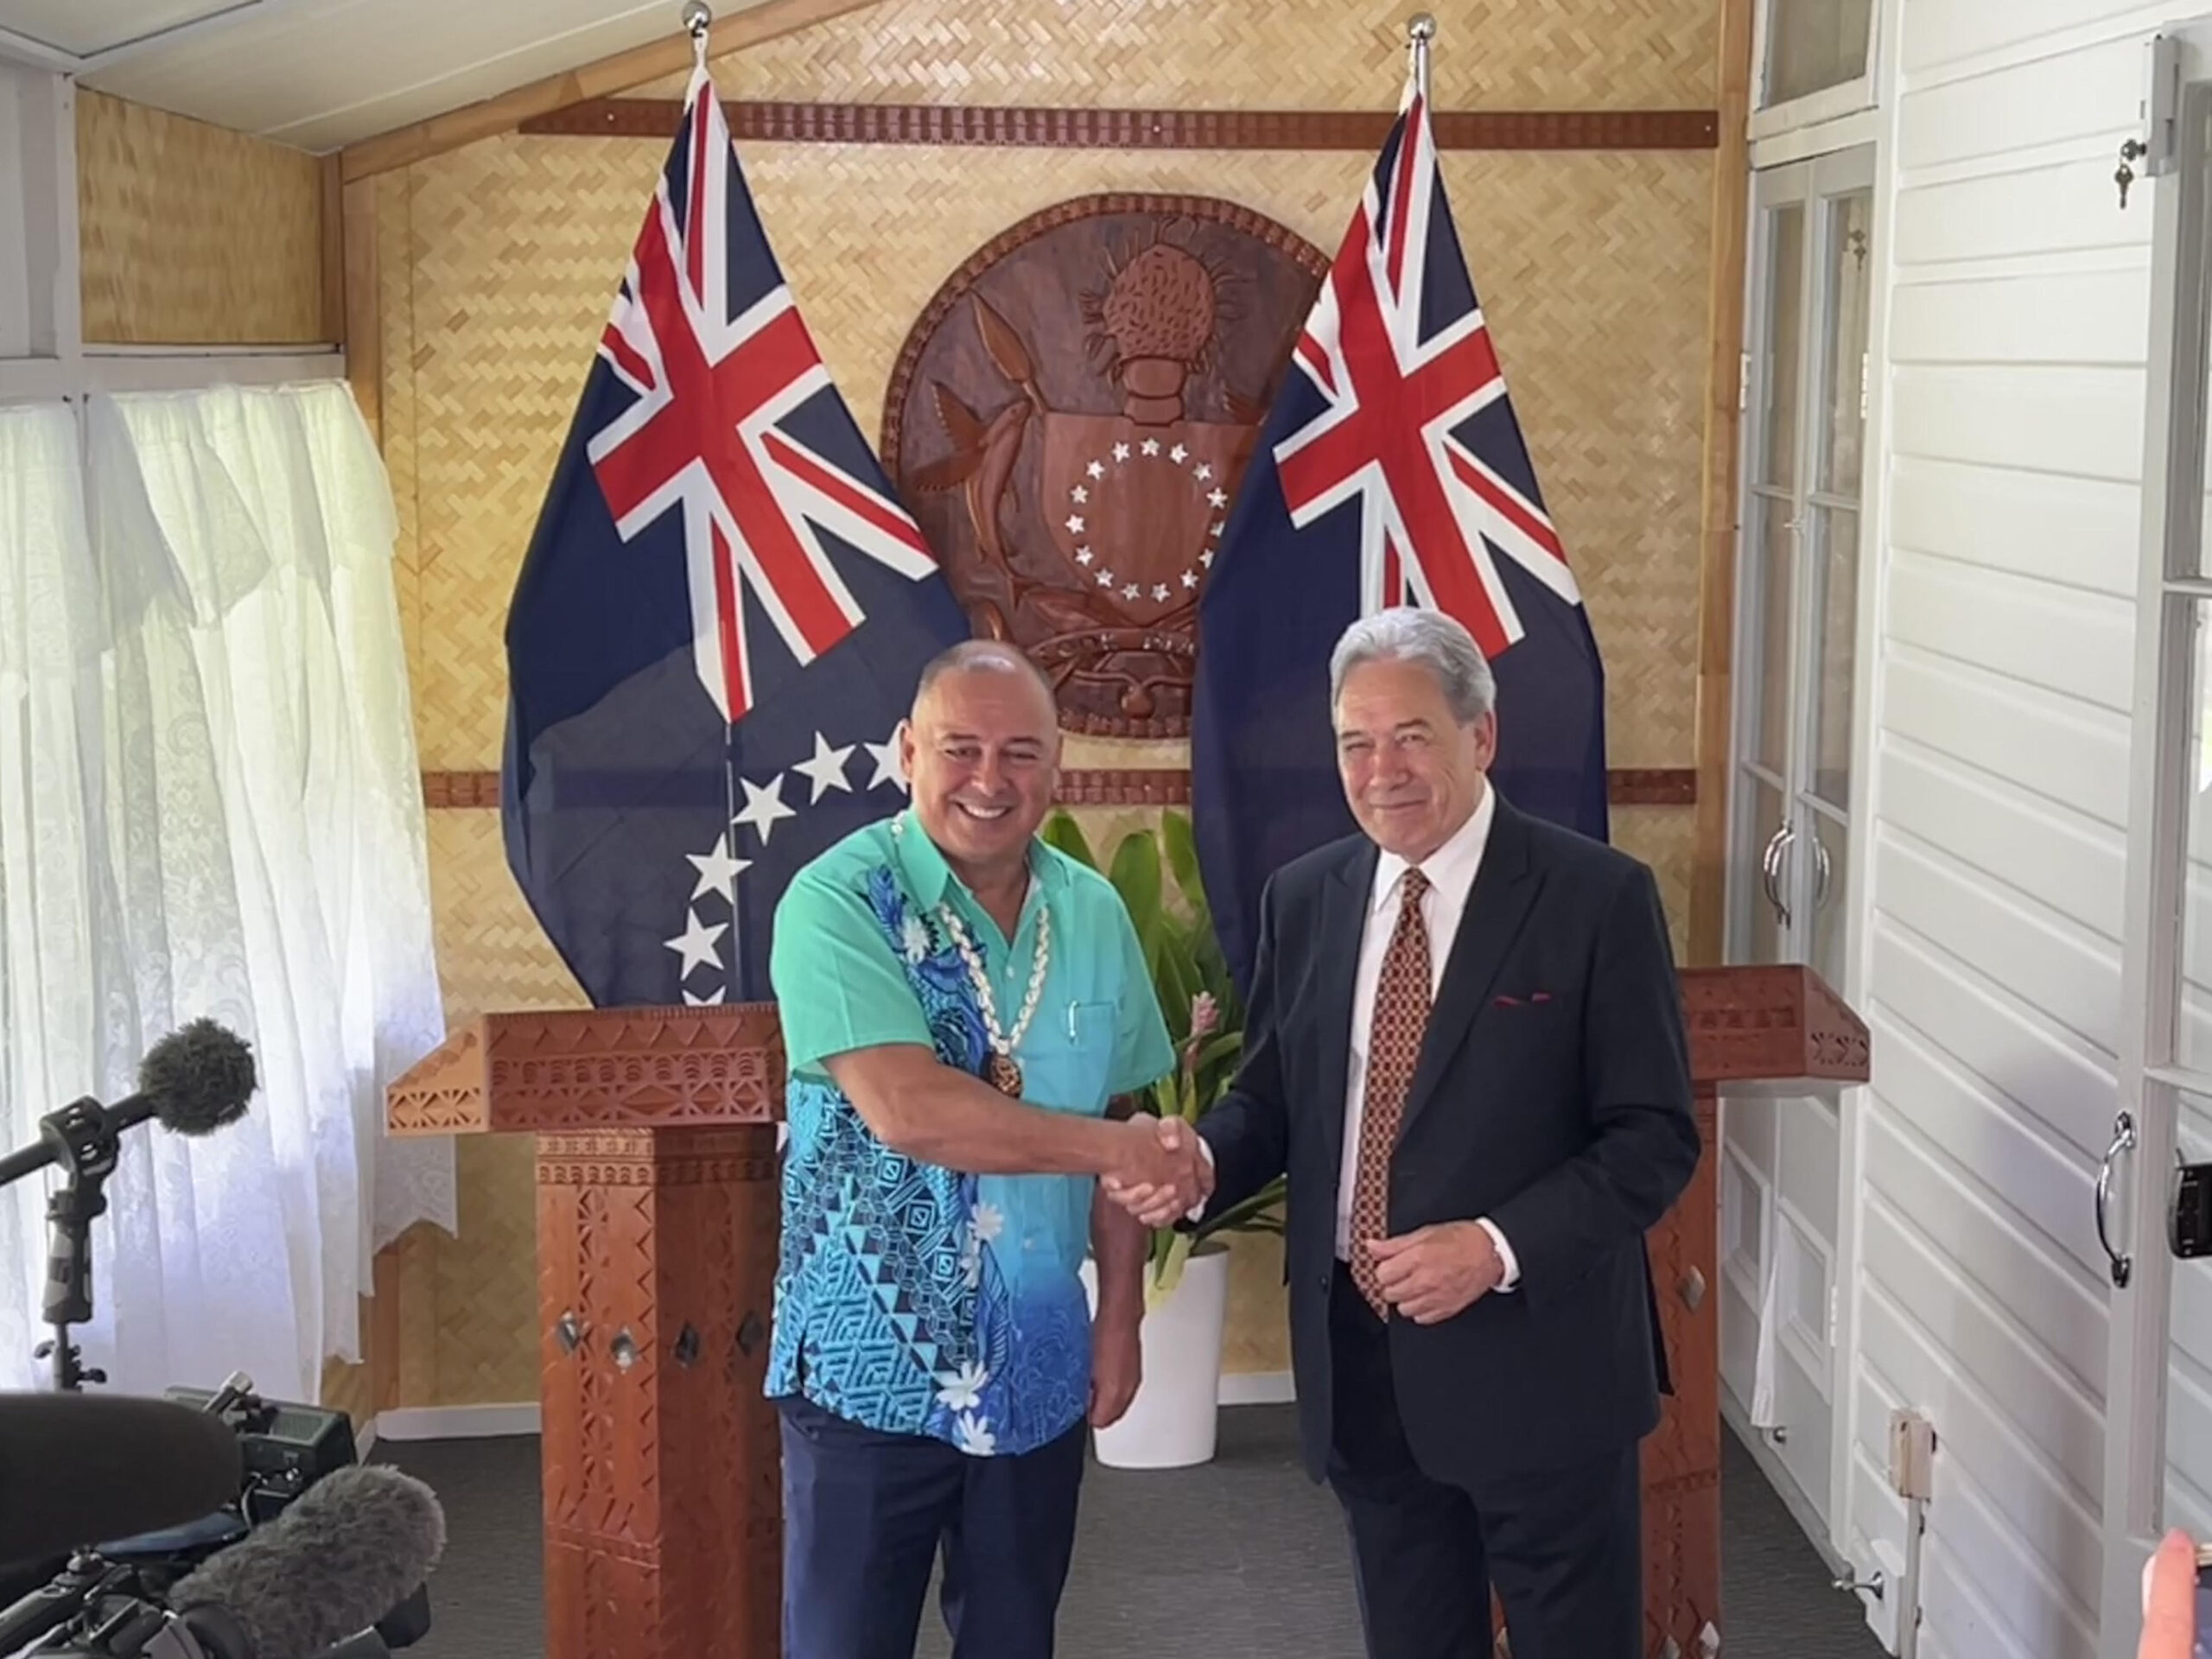
‘Nothing to worry about’: Prime Minister Brown on China agreement
16 February 2025

‘Serious questions’: Opposition challenges China partnership
15 February 2025

No-confidence motion against PM and his Cabinet faces delays
15 February 2025


Ruta Mave: People’s Republic of China red flag
10 February 2025

No debt in China deal
8 February 2025
Thomas Wynne: Haka with the taniwha or dance with the dragon?
8 February 2025

‘Paedophile’ gets 13 years in prison
22 January 2025
Thomas Wynne: Where were our leaders while children suffered?
25 January 2025


$541.7m tourism earnings
25 January 2025
Cook Islands passport proposal
6 January 2025


Police need numbers and bigger budget
9 December 2024

Niki Rattle: A call for stronger human rights protections
10 December 2024

Solid and Hazardous Waste Bill referred to Parliament committee
10 December 2024


DPM defends CIIC finance and travel policies
6 December 2024

Cook Islands has its first mosque
14 November 2024

CI Muslim opens up about her faith and journey
16 November 2024

RAC to address mosque legality
19 November 2024

I don’t expect much change: PM Brown on US Elections
6 November 2024

Fifth weekly Sydney flight to Rarotonga announced
23 October 2024
CIIC directors seek $350,000 in damages over defamatory claims
21 October 2024
Man found guilty of rape, burglary
24 September 2024

Tenants face water bill burden
8 October 2024


Concerns over Minister’s role in inmate work releases: PAC
5 October 2024
Anxiety on the rise: Cook Islands faces mental health challenge
7 September 2024

MCI rejects ‘dark fleet’ label
3 August 2024
Mike Carr: Water usage ‘facts’- A closer look at TTV’s report
Saturday 31 August 2024 | Written by Supplied | Published in Editorials, Opinion

Mike Carr. 230505130
The recent lack of rain fall, and therefore water pressure, and the proposed water tariffs, have combined to make a perfect storm of the topic of water usage, evidenced by recent headlines and articles in the printed press and (I understand) significant discussion/debate on social media, writes Mike Carr.
Cook Islands News ran a front-page article on Monday, August 26, which included a number of quotes from the recently released “Financial/Regulatory Assessment and Tariff Structure Alternatives” report dated 28 June 2024. In the last column of the article, CI News quotes from the “Executive Summary” on page 5 of the report that “2)The largest users of water services are the hotels...”. However, according to the details in the report, this statement is at best misleading. It may be true that the two biggest individual users of water are hotels. But the usage of the two largest accommodation properties, does not somehow become an average, or indicator of the tourism sector's total water usage. The size of accommodation properties on Rarotonga quickly reduces (name 10 large properties?). It’s a bit like saying Wigmore’s farm usage would be the norm for all the agricultural sector.
Being a humble accountant, I often take more heed of the numbers, rather than the words. So let’s look at the numbers, what does the detail in the report actually say?
On page 38 of the report, we find Table 2-7 titled “Estimated Consumed Volumes by Customer Class”, for the 2023 year. The numbers are in cubic metres.
Combining “Free Water Allocation” and “Residential” we have a total of 755,857, “Commercial/Industrial” is 620,500, Institutional is 182,500, Agricultural is 1,679,000, and Tourism is 706,640.
In other words, according to To Tatou Vai research, in the 2023 year, Agriculture water usage is estimated to be almost 2.5 times Tourism usage.
But by far, the biggest “user”, towards the top of the page, is “Leakage”, at 1,468,449 cubic meters. The report notes that this is 27.1 per cent of “Total Production”. It is estimated that over one quarter of water is “lost”! That’s after we spent $100 million “fixing” the system!
The report also shows the percentage used by usage class, net of the leakage. In order of usage we have Agricultural at 42.6%, Free Water Allocation & Residential 19.2%, Tourism 17.9%, Commercial / Industrial 15.7%, and Institutional at 4.6%.
On page 37 of the report we have some commentary on the assumptions used. “Tourism – comprehensive analysis, testing and calculations from TTV staff indicate that an average usage of 1936 cubic metres per day for the class as a whole should be used.” I note that meters were installed on many tourism properties beginning November 2023, therefore the data collected by TTV is recent and, one assumes, fairly reliable. The 1936 cubic metres per day times 365 equals the 706,640 cubic metres per year of table 2-7.
The commentary for Agricultural says “used AECOM’s estimate of 4600 cubic metres per day for the class as a whole. However, early meter testing by TTV staff indicates that this number may be revised upwards in future forecasts” This means it is likely to be more! The 4600 cubic metres per day times 365 equals the 1,679,000 cubic metres per year of table 2-7.
Now don’t shoot the messenger, these numbers are not mine, I didn’t make them up, they are direct from the TTV report, which is available online on To Tatou Vai’s website under About Us/Publications/Proposed Tariff Study.
So the report’s conclusion that “The largest users of water services are the hotels”, is misleading when their own data clearly shows that the total water usage of the tourism sector is less than the leakage, less than residential use, and less than agricultural use. Of course, it is good for their narrative that the tourism sector should pay (because they use the most water!?), but by their own research this is not true.
You will also note on the TTV website, that their values include “Honesty” and “Clear Communications”. Both appear to be lacking in this case.
The full quote from page 5 of the report says “2)The largest users of water services are the hotels, and there is no current method of confirming whether the tax revenues paid by hotels and other tourist-related businesses are covering the cost of water provided to tourists”. This full comment is both misleading and mischievous, but also fits the TTV narrative that the tourism sector should pay more.
The simplest way of verifying that accommodators are paying their way, would be for TTV to visit Revenue Management and ask for the total VAT receipts for the year from the tourism sector (that wouldn’t breach any individual taxpayers’ confidentiality rules). I can assure you that the sector is more than covering “the cost of water provided to tourists”, from just VAT receipts, let alone income tax payments.
Interesting that the report doesn’t question whether other users, such as Commercial/Industrial or Agriculture are paying taxes that cover their usage.
Of course, now it has rained, we will have more reasonable pressure, and hopefully more reasonable debate, until November this year, when we will be in the midst of the usual dry season.
- Mike Carr, formally a chartered accountant, currently manager at Lagoon Breeze Villas.